转自了凡春秋的博客
工具箱的使用
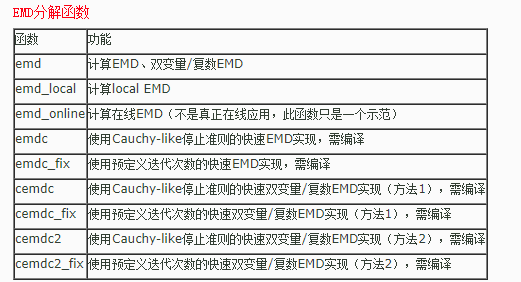
工具箱函数
运行help index_emd可以查看工具箱提供的函数,如下
index_emd.M list of functions in the EMD package
type help function_name for more information on a specific function
Empirical Mode Decomposition
emd          - computes EMD and bivariate/complex EMD with various options
emd\_local    - computes local EMD variation
emd\_online   - computes on-line EMD variation. Note that it does not truly
               apply on-line: the function is only a demonstration.
emdc         - fast implementation for EMD with Cauchy-like stopping criterion
               (requires compilation, see make\_emdc function)
emdc\_fix     - fast implementation for EMD with predefined number of iterations
               (requires compilation, see make\_emdc function)
cemdc        - fast implementation for bivariate/complex EMD (first algorithm)
               with Cauchy-like stopping criterion (requires compilation,
               see make\_emdc function)
cemdc\_fix    - fast implementation for bivariate/complex EMD (first algorithm)
               with predefined number of iterations (requires compilation,
               see make\_emdc function)
cemdc2       - fast implementation for bivariate/complex EMD (second algorithm)
               with Cauchy-like stopping criterion (requires compilation,
               see make\_emdc function)
cemdc2\_fix   - fast implementation for bivariate/complex EMD (second algorithm)
               with predefined number of iterations (requires compilation,
               see make\_emdc function)
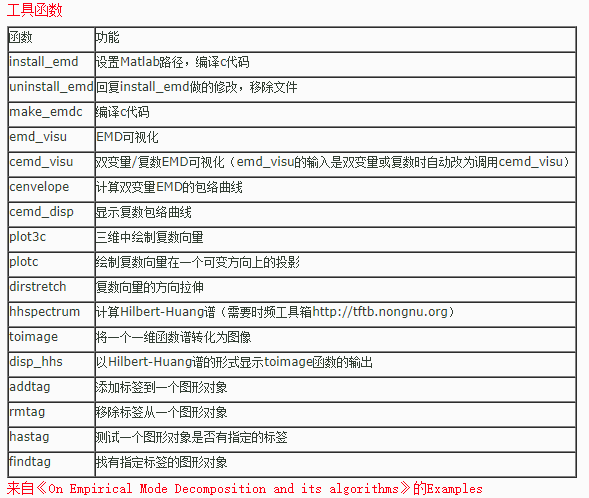
Utilities
install\_emd   - setup Matlab's path and compile the C codes.
uninstall\_emd - revert the modifications made by install\_emd and remove the
                files (optional).
make\_emdc     - compile all C codes
emd\_visu      - visualization of EMD
cemd\_visu     - visualization of bivariate/complex EMD (automatically called
                by emd\_visu when the input is complex)
cenvelope     - compute envelope curves for bivariate/complex EMD
cemd\_disp     - visualization of envelope curves and tube envelope
plot3c        - plot a complex vector in 3 dimensions
plotc         - plot the projection of a complex vector on a variable direction
dirstretch    - directional stretching of a complex vector
hhspectrum    - compute Hilbert-Huang spectrum (need the Time-Frequency Toolbox
                [http://tftb.nongnu.org)](http://tftb.nongnu.org%29/)
toimage       - transform a spectrum made of 1D functions (e.g., output of
                "hhspectrum") in an 2D image
disp\_hhs      - display the image output of "toimage" as a Hilbert-Huang spectrum
addtag        - add a tag to a graphic object (uses the Tag property as a list
                of keywords or "tags")
rmtag         - remove a tag from a graphic object (uses the Tag property as
                a list of keywords or "tags")
hastag        - test whether a graphic object has a specific tag (uses the Tag
                property as a list of keywords or "tags")
findtag       - find objects having a specific tag (uses the Tag property as
                a list of keywords or "tags")
Examples from G. Rilling, P. Flandrin and P. Gon鏰lves,
“On Empirical Mode Decomposition and its algorithms”
IEEE-EURASIP Workshop on Nonlinear Signal and Image Processing
NSIP-03, Grado (I), June 2003
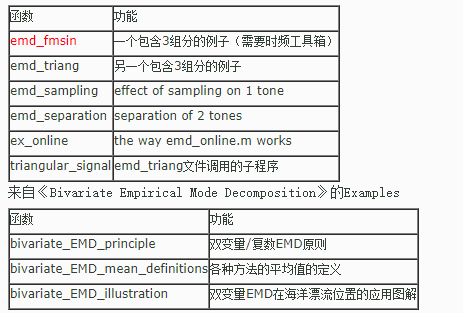
emd\_fmsin         - Fig. 1: a 3-component example (need the Time-Frequency
                    Toolbox [http://tftb.nongnu.org)](http://tftb.nongnu.org%29/)
emd\_triang        - Fig. 2: another 3-component example
emd\_sampling      - Fig. 3: effect of sampling on 1 tone
emd\_separation    - Fig. 4: separation of 2 tones
ex\_online         - Sect 3.4: the way emd\_online.m works
triangular\_signal - subroutine called by emd\_triang (formerly triang.m)
Examples from G. Rilling, P. Flandrin, P. Gon鏰lves and J. M. Lilly,
“Bivariate Empirical Mode Decomposition”,
Signal Processing Letters (submitted)
bivariate\_EMD\_principle        - Fig. 1: principle of the bivariate/complex EMD
bivariate\_EMD\_mean\_definitions - Fig. 2: definition of the mean for each algorithm.
                                 Also allows to test other signals and parameter sets.
bivariate\_EMD\_illustration     - Fig. 3: illustration of the bivariate EMD
                                 on an oceanographic float position record
稍做整理如下:
工具箱使用示例
EMD
clc
clear all
close all
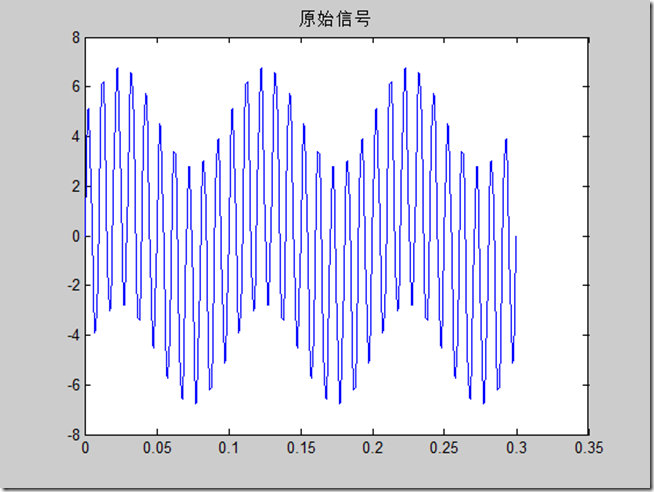
% 原始数据
fs = 1000;
ts = 1/fs;
t=0:ts:0.3;
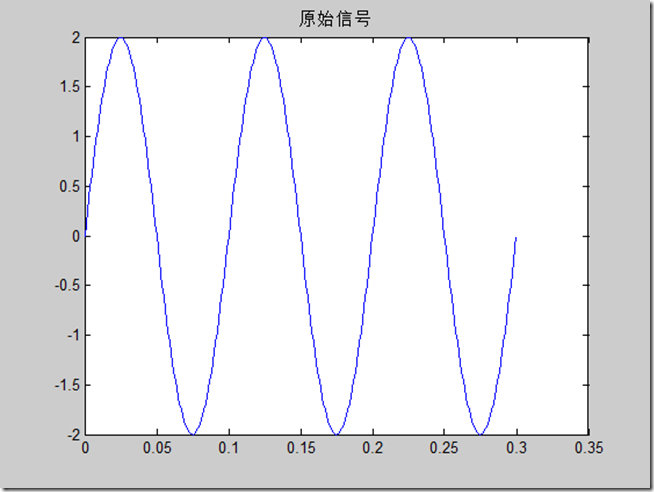
z=2\*sin(2\*pi\*10\*t) + 5.\*sin(2\*pi\*100\*t);
figure
plot(t, z)
title('原始信号')
% EMD
imf=emd(z);
emd\_visu(z,t,imf)
\[A,f,tt\]=hhspectrum(imf);
\[im,tt\]=toimage(A,f);
disp\_hhs(im);
边际谱
clc
clear all
close all
% 原始数据
fs = 1000;
ts = 1/fs;
t=0:ts:0.3;
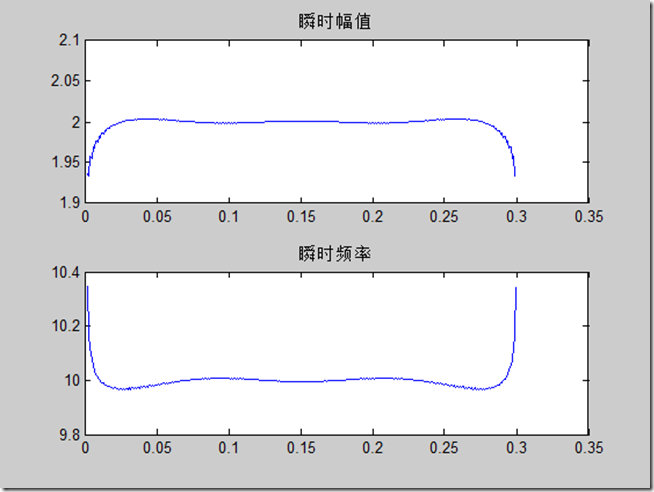
y=2\*sin(2\*pi\*10\*t);% + 5.\*sin(2\*pi\*100\*t);
figure
plot(t, y)
title('原始信号')
% 求Hilbert-Huang谱
\[A,fh,th\] = hhspectrum(y);
figure
subplot(211)
plot(th\*ts, A)
title('瞬时幅值') % 就是包络
subplot(212)
plot(th\*ts, fh\*fs)
title('瞬时频率')
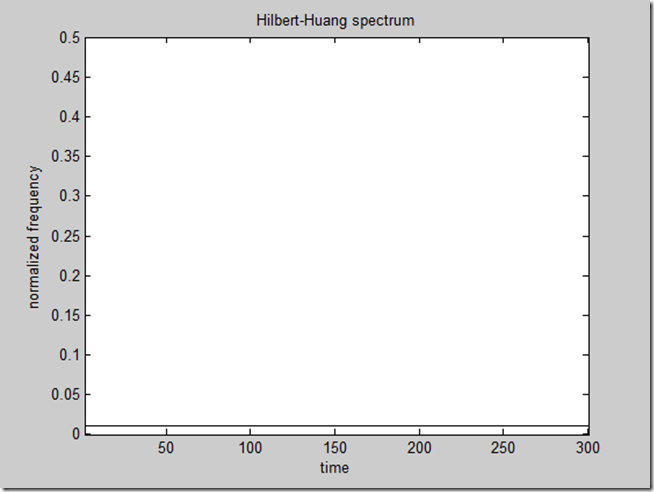
% 显示结果
\[im,tt,ff\] = toimage(A,fh,th);
disp\_hhs(im,tt)
colormap(flipud(gray))
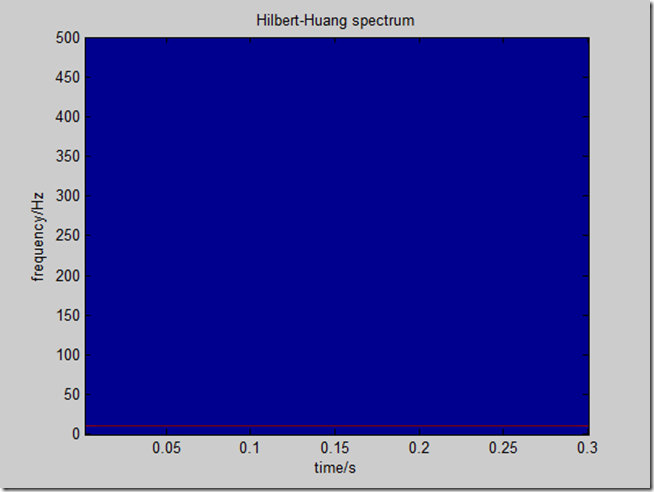
% 编程实现显示
figure
imagesc(tt\*ts,\[0,0.5\*fs\],im);
ylabel('frequency/Hz')
set(gca,'YDir','normal')
xlabel('time/s')
title('Hilbert-Huang spectrum')
例子程序
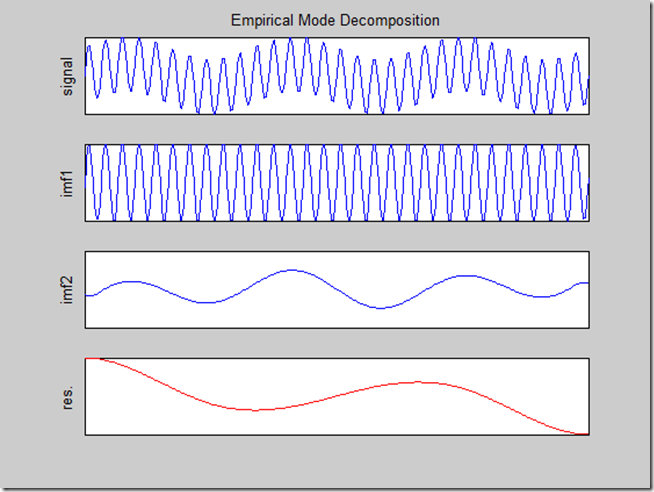
更详细的使用说明可以参见例子程序,如emd_fmsin.m程序,运行结果如下
EMD分解如下

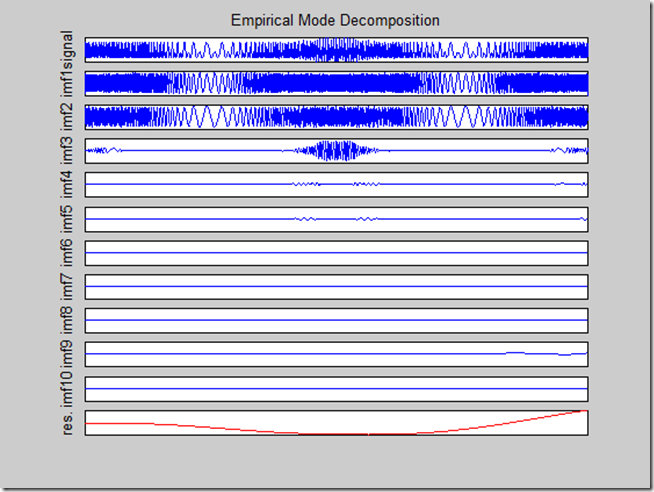
可以看到,EMD实现的3个组分的分离(即分别分解到了IMF1~3中),可见EMD的强大功能。
为便于以后查阅,代码也贴过来吧:
N = 2000;% # of data samples
T = 1:4:N;
t = 1:N;
p = N/2;% period of the 2 sinusoidal FM's
% sinusoidal FM 1
fmin1 = 1/64;% min frequency
fmax1 = 1.5\*1/8;% max frequency
x1 = fmsin(N,fmin1,fmax1,p,N/2,fmax1);
% sinusoidal FM 1
fmin2 = 1/32;% min frequency
fmax2 = 1.5\*1/4;% max frequency
x2 = fmsin(N,fmin2,fmax2,p,N/2,fmax2);
% logon
f0 = 1.5\*1/16;% center frequency
x3 = amgauss(N,N/2,N/8).\*fmconst(N,f0);
a1 = 1;
a2 = 1;
a3 = 1;
x = real(a1\*x1+a2\*x2+a3\*x3);
x = x/max(abs(x));
\[imf,ort,nbits\] = emd(x);
emd\_visu(x,t,imf,1);
figure(1)
% time-frequency distributions
Nf = 256;% # of frequency bins
Nh = 127;% short-time window length
w = tftb\_window(Nh,'Kaiser');
\[s,rs\] = tfrrsp(x,T,Nf,w,1);
\[s,rs1\] = tfrrsp(imf(1,:)',T,Nf,w,1);
\[s,rs2\] = tfrrsp(imf(2,:)',T,Nf,w,1);
\[s,rs3\] = tfrrsp(imf(3,:)',T,Nf,w,1);
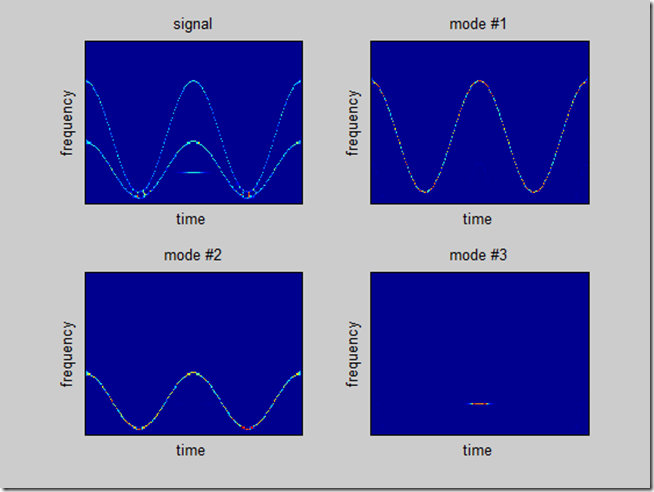
figure(4)
subplot(221)
imagesc(flipud(rs(1:128,:)))
set(gca,'YTick',\[\]);set(gca,'XTick',\[\])
xlabel('time')
ylabel('frequency')
title('signal')
pause
subplot(222)
imagesc(flipud(rs1(1:128,:)))
set(gca,'YTick',\[\]);set(gca,'XTick',\[\])
xlabel('time')
ylabel('frequency')
title('mode #1')
pause
subplot(223)
imagesc(flipud(rs2(1:128,:)))
set(gca,'YTick',\[\]);set(gca,'XTick',\[\])
xlabel('time')
ylabel('frequency')
title('mode #2')
pause
subplot(224)
imagesc(flipud(rs3(1:128,:)))
set(gca,'YTick',\[\]);set(gca,'XTick',\[\])
xlabel('time')
ylabel('frequency')
title('mode #3')